Unlock the Power of Precision with the Ultimate Support and Resistance Indicator
Are you tired of manually drawing lines on your chart, only to second-guess if you've identified the right levels? For both new and experienced traders, accurately pinpointing support and resistance zones is the bedrock of successful technical analysis. It’s the difference between a well-timed entry and a frustrating loss.
What if you could automate this entire process? Imagine an indicator that does the heavy lifting for you, clearing up your charts and highlighting high-probability trading zones with institutional-grade accuracy.
Introducing the Support and Resistance with Order Blocks Indicator for TradingView. This powerful tool is designed to give you a clear, decisive edge in any market.
What is Support and Resistance? A Quick Refresher
Before we dive into the indicator, let's quickly recap these fundamental concepts:
Support: A price level where a downtrend is likely to pause or reverse due to a concentration of buying interest. Think of it as a price floor.
Resistance: A price level where an uptrend is likely to pause or reverse due to a concentration of selling interest. Think of it as a price ceiling.
Mastering these levels allows you to anticipate market movements, set effective entry and exit points, and manage your risk like a professional.
Key Features of the Indicator
This isn't just another line-drawing tool. It leverages sophisticated algorithms based on Smart Money Concepts (SMC) to deliver unparalleled performance.
Automatic Zone Detection: The indicator intelligently scans the price action and automatically plots the most significant support and resistance zones. No more guesswork or cluttered charts.
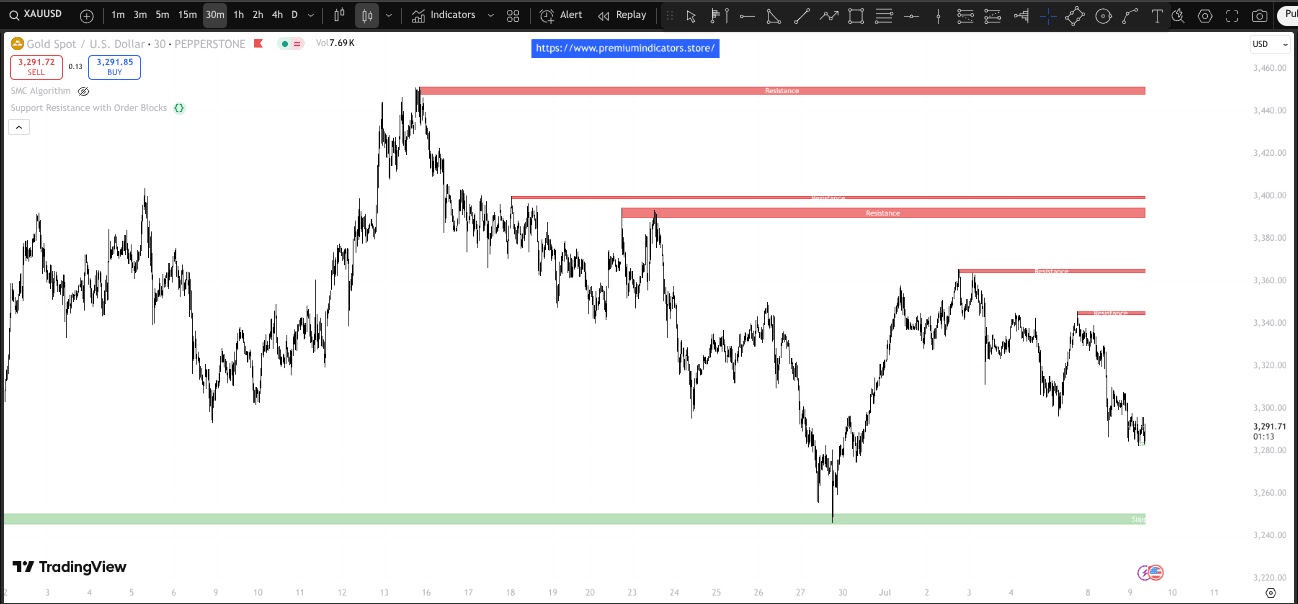
Clear, Color-Coded Visuals: As seen in the image, resistance zones are marked in red, and support zones are marked in green. This allows for an immediate, intuitive understanding of the current market structure.
Powered by Order Blocks: Unlike basic pivot-point indicators, this tool identifies "Order Blocks"—areas where large institutional orders have been placed. These are powerful zones where price is highly likely to react, giving you an edge over retail traders.
Dynamic and Adaptive: The market is always changing, and so is our indicator. It adapts in real-time, plotting new zones as the market structure evolves, ensuring you always have the most relevant levels on your chart.
How to Use This Indicator in Your Trading
Integrating this indicator into your strategy is simple and effective. Here are a few ways to use it:
Reversal Trading:
Sell Signal: When the price enters a red resistance zone and shows signs of rejection (like a bearish engulfing candle or a pin bar), it's a high-probability signal to enter a short (sell) position.
Buy Signal: When the price drops into a green support zone and begins to bounce, look for bullish confirmation to enter a long (buy) position.
Breakout and Retest Strategy:
When the price breaks decisively above a resistance zone, that zone often flips to become new support. Wait for a retest of this new support level to enter a long position.
Conversely, a strong break below a support zone can signal a continued move down. The broken support level may now act as resistance.
Setting Stop-Loss and Take-Profit:
Stop-Loss: Place your stop-loss just above a resistance zone for a short trade, or just below a support zone for a long trade. This provides a logical and protected placement for your orders.
Take-Profit: Use the next opposing zone as your target. If you buy at support, your take-profit could be the next resistance zone, maximizing your risk-to-reward ratio.
Download the Indicator for TradingView
Ready to take your trading to the next level? Get instant access to the Support and Resistance indicator by clicking the download button below. The text file contains the necessary information to get you started.
Download
Please Support Our Work
We are passionate about creating high-quality tools that genuinely help traders succeed. If you find this indicator valuable, please consider supporting our ongoing development and motivation with a small donation. Every contribution helps us improve our tools and create new ones.
Please donate us $5 for motivation. Thank you for your support!
Conclusion
Stop trading in the dark. The Support and Resistance with Order Blocks Indicator illuminates the most critical price levels, giving you the confidence to execute trades with precision. By automating technical analysis and leveraging smart money concepts, you can finally focus on what truly matters: making consistent, profitable decisions.
Download it today and transform the way you see the markets
No comments:
Post a Comment